

2023 Australia Employee earnings (by state, industry and gender)
Here we show the 2023 Australia Employee earnings by industry. All data is from https://www.abs.gov.au/statistics/labour/earnings-and-working-conditions/employee-earnings/latest-release#data-downloads. Although ABS.gov webpage alraday give us a few graphs and tables about the salary in Australia. The graphs show limited information compared with the raw data. For example, the salary histogram about State and territory only shows 2018 and 2023. There is much more information hidden in the data. We download the raw data and deal it, to show more detailed information. All of the graphs are interactive. And we also checked the dealed data with ABS.gov table, to make sure what we are doing is accurate.
At ABS.gov, we get Median weekly earnings in main job, by industry, only in 2018 and 2023, shown by histgram. Let show them by Map and with more Years.
First, Australian median weekly salary from 2018-2023, by state.
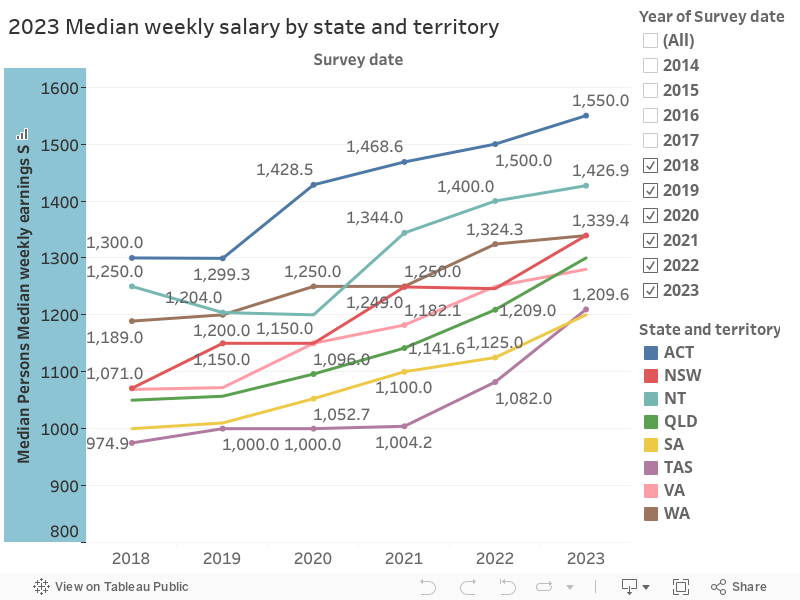
The ACT has the highest median earning all over the range from 2018 to 2023.
The difference between industires.
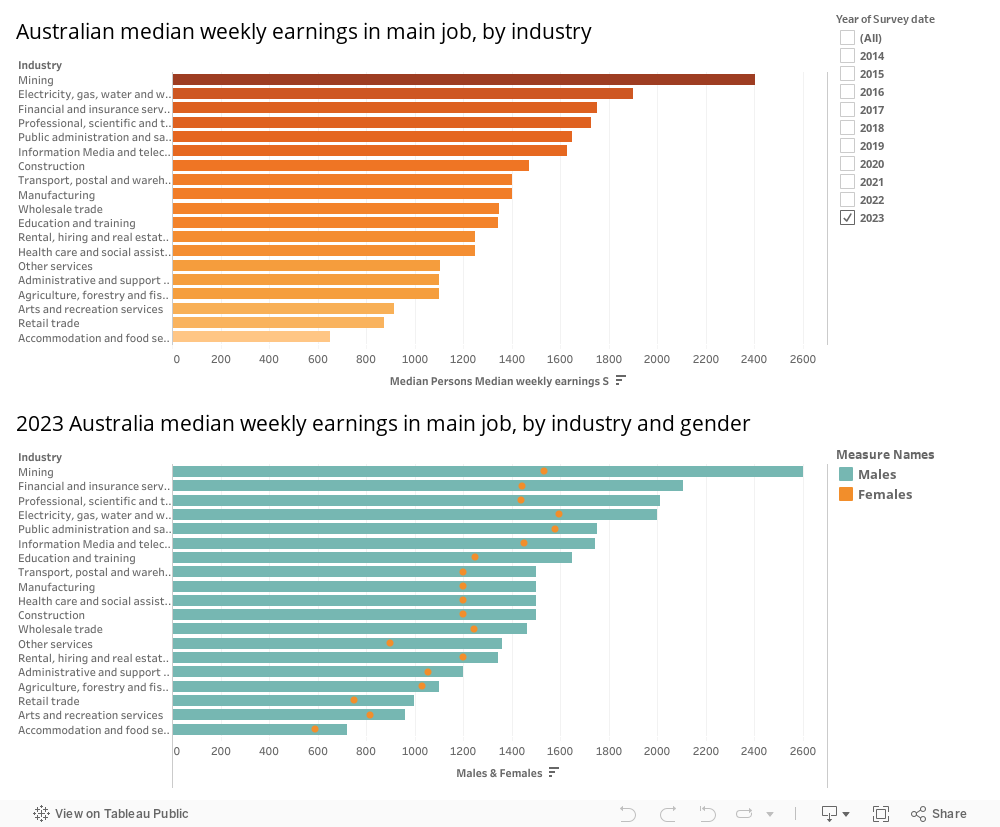
Mining has the highest salary, in the year 2023, the median weekly earning is over 2300 AUD. Also the earning difference between male and female is very large in this industry. The fields of Agriculture, forestry and fishing have the lowest salary gap between genders. Accommodation and food services have the lowest salary, which is about 650 AUD a week.
The Python codes for cleaning the data as follows. Anyone can coppy them directely to your jupternotebook and use them. Change the save path to your own.
import pandas as pd
import numpy as np
pd.set_option('display.max_columns',None)

data_1 = pd.read_excel('https://www.abs.gov.au/statistics/labour/earnings-and-working-conditions/employee-earnings/aug-2023/63370_Table03.xlsx', sheet_name='Data 3')

data_1.dropna(subset='Unnamed: 6', inplace=True)

data_1.columns=['Survey_date', 'State and territory',
                'Leave entitlements', 'Industry',
                'Classification', 'Category',
                'Persons_Median_weekly_earnings_S',
                'Persons_Median_weekly_earnings_RSE',
                'Persons_Median_Hourly_earnings_S',
                'Persons_Median_Hourly_earnings_RSE',
                'Persons_Employees_number', 'Persons_Employees_RSE',
                'Males_Median_weekly_earnings_S',
                'Males_Median_weekly_earnings_RSE',
                'Males_Median_Hourly_earnings_S',
                'Males_Median_Hourly_earnings_RSE',
                'Males_Employees_number', 'Males_Employees_RSE',
                'Females_Median_weekly_earnings_S',
                'Females_Median_weekly_earnings_RSE',
                'Females_Median_Hourly_earnings_S',
                'Females_Median_Hourly_earnings_RSE',
                'Females_Employees_number',
                'Females_Employees_RSE'
               ]
data_1.dropna(axis=0,inplace=True)
data_1.drop(axis=0,index=6,inplace=True)
data_1.reset_index(drop=True,inplace=True,)

data_1['Survey_date']=pd.to_datetime(data_1['Survey_date'])

data_1[['Persons_Median_weekly_earnings_S',
        'Persons_Median_weekly_earnings_RSE',
        'Persons_Median_Hourly_earnings_S',
        'Persons_Median_Hourly_earnings_RSE',
        'Persons_Employees_number',
        'Persons_Employees_RSE',
        'Males_Median_weekly_earnings_S',
        'Males_Median_weekly_earnings_RSE',
        'Males_Median_Hourly_earnings_S',
        'Males_Median_Hourly_earnings_RSE',
        'Males_Employees_number',
        'Males_Employees_RSE',
        'Females_Median_weekly_earnings_S',
        'Females_Median_weekly_earnings_RSE',
        'Females_Median_Hourly_earnings_S',
        'Females_Median_Hourly_earnings_RSE',
        'Females_Employees_number',
        'Females_Employees_RSE'
        ]] = data_1[['Persons_Median_weekly_earnings_S',
                     'Persons_Median_weekly_earnings_RSE',
                     'Persons_Median_Hourly_earnings_S',
                     'Persons_Median_Hourly_earnings_RSE',
                     'Persons_Employees_number',
                     'Persons_Employees_RSE',
                     'Males_Median_weekly_earnings_S',
                     'Males_Median_weekly_earnings_RSE',
                     'Males_Median_Hourly_earnings_S',
                     'Males_Median_Hourly_earnings_RSE',
                     'Males_Employees_number',
                     'Males_Employees_RSE',
                     'Females_Median_weekly_earnings_S',
                     'Females_Median_weekly_earnings_RSE',
                     'Females_Median_Hourly_earnings_S',
                     'Females_Median_Hourly_earnings_RSE',
                     'Females_Employees_number',
                     'Females_Employees_RSE'
                   ]].astype('float')

data_1[['State and territory',
        'Leave entitlements', 'Industry',
        'Classification', 'Category',
       ]] = data_1[['State and territory',
                    'Leave entitlements', 'Industry',
                    'Classification', 'Category',
                   ]].astype('string')

data_1.to_excel('your_own_path/after_Table03.xlsx')
One Comment
Servis_taOi
Лучший сервис для вашего Хонда: профессиональный подход к каждой детали.
Honda обслуживание http://www.honda-avtoservis.ru .