

Using Python to deal with battery cycle data
When we got the battery cycle data, we had millions or even billions of data points of charge-discharge capacity-voltage curve. If we have time, we may use the tester software to manually select the data curves we want.
What should we do if we get the raw data of all cycle data?
Let’s see an example using Python and Tableau to deal with the data.
Now we get raw data of a battery cycle performance test. It runs about 100+ cycles, and 40 thousand raws × 2 clomuns.
First, import the libraries we will use in Python.
import pandas as pd
import numpy as np
import matplotlib.pyplot as plt
import seaborn as sns
Then, load the data we get.
df = pd.read_excel('your file path/file name.xlsx')Let us check the data.
df.shape
df.head()
we will get:(40216, 3) and first 6 rows of the excel, which means 40216 rows and 3 columns, and the column is ‘index’, ‘capcity/mAh/g’ and ‘voltage/V’
Let’s slice the data. Give the data cycle number and charge or discharge status. This will help us draw figures in Tableau.
How to slice the data? We first ask the tester the logics of the charge-discharge process. They use constant current to charge and discharge the battery. When voltage lower than 0.8 V, the process goes to charge, and when voltage larger than 2.8 V, the process goes to discharge. The process begins with charge, end until cycle numbers larger than input (manually set).
Then we can give the data cycle numbers and charge-discharge status. The cycle number and status are used in Tableau to color or filter the data or as the axis for the figure.
cycle = 1
for i in range(len(df['Voltage/V'])):
    df.loc[i,'cycle'] = cycle
    df.loc[0,'status'] = 'charge'

    if (df.loc[i,'status'] == 'charge') & (df.loc[i,'Voltage/V'] <= 2.8):
        df.loc[i+1,'status'] = 'charge'

    elif (df.loc[i,'status'] == 'charge') & (df.loc[i,'Voltage/V'] > 2.8):
        df.loc[i+1,'status'] = 'discharge'

    elif (df.loc[i,'status'] == 'discharge') & (df.loc[i,'Voltage/V'] >= 0.8):
        df.loc[i+1,'status'] = 'discharge'

    elif (df.loc[i,'status'] == 'discharge') & (df.loc[i,'Voltage/V'] < 0.8):
        cycle += 1
        df.loc[i+1,'status'] = 'charge'


df.dropna(inplace=True)
df.to_csv('your path/after data.csv')
Now each row of the data was given the cycle number and charge-discharge status. They are easily import to Tableau and be shown.
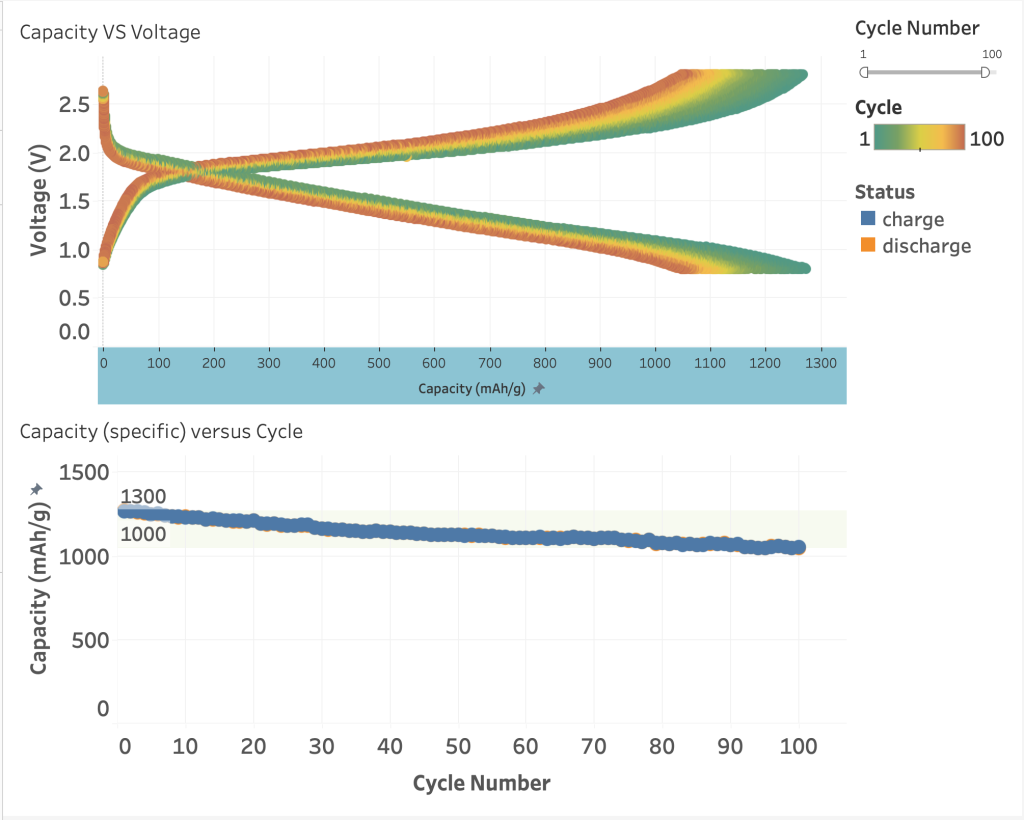
Wow, let’s see what we can get. All the charge-discharge capacity VS voltage, Capacity VS Cycle numbers. For capacity VS voltage figure, we set capacity as column and voltage as arrow, draw cycle to color. For Capacity VS Cycle numbers, we set cycle as column and capacity as arrow and let column number is maximum number, and draw status to color to divid the charge capacity and discharge capacity.
(From Toby via Linkedin.)
One Comment
Toby
This code gives the raw battery cycle data cycle numbers and charge-discharge status, especially good for Tableau. For Origin, we need to slice the data, the code will be different. In this state, we need to slice the raw data into different columns.